Introduction
On 11 February 2025, Transparency International (TI) released its Corruption Perceptions Index (CPI). The CPI 2024 evaluated and ranked 180 countries and territories based on their perceived levels of public sector corruption with a measurement scale of 0 to 100, where 100 corresponds to a very clean environment and 0 indicates high level of corruption. The CPI 2024 is produced using 13 distinct external sources produced by 12 distinct institutions capturing perceptions of corruption within the past two years.
Global Overview
The CPI 2024 highlights that 32 countries have significantly improved in the fight against corruption since 2012 whereas 148 countries have stayed stagnant or gotten worse during the same period. The global average of 43 has also stood still for years, while over two-thirds of countries score below 50.
With a score of 90, Denmark tops the ranking for the seventh consecutive year. Finland and Singapore take the second and third spots, with scores of 88 and 84, respectively. For the first time since 2012, New Zealand slipped out of the top three positions with the score of 83, but maintains its streak in the top 10, along with Luxembourg (81), Norway (81), Switzerland (81), Sweden (80), the Netherlands (78), Australia (77), Iceland (77) and Ireland (77). On the other hand, South Sudan (8), Somalia (9) and Venezuela (10) take the bottom three spots closely followed by Syria (12), Equatorial Guinea (13), Eritrea (13), Libya (13), Yemen (13), Nicaragua (14), Sudan (15) and North Korea (15) completing the list of lowest scorers.
Further analysis on the CPI 2024 reveals stark contrast between nations with strong, independent institutions and free, fair elections, and those with repressive authoritarian regimes. Full democracies have a CPI average of 73, while flawed democracies average 47 and non-democratic regimes just 33. This highlights that democracy and strong institutions including constructive civic engagements are crucial for combatting corruption fully and effectively.
In the Asia Pacific region, despite its vulnerability to natural disasters, the CPI 2024 underscored that the governments across Asia Pacific need to deliver on anti-corruption pledges.
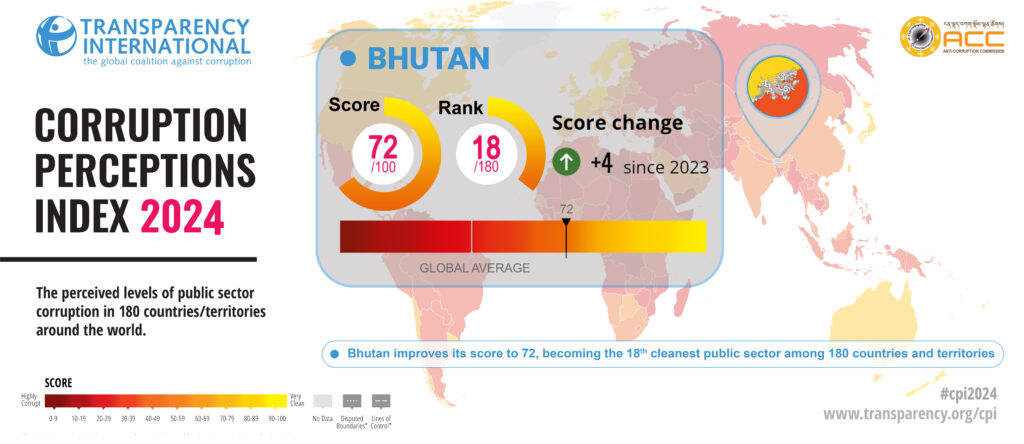
Bhutan’s Score and Rank
Bhutan has shown remarkable progress in the CPI 2024 by improving its score to 72 from 68 in 2023 and becoming the 18th cleanest country among 180 countries and territories from 26th in 2023. This is one of the statistically significant improvements that Bhutan has made since 2012. With this improvement, CPI 2024 places Bhutan in the list of significant movers, surpassing the countries such as Austria, Barbados, Belgium, France, Japan, United Kingdom, United States of America, and Seychelles which were placed above Bhutan in the erstwhile CPIs.
In the Asia-Pacific region, Bhutan for the first time, improved to 5th position after a decade-long stalemate at the 6th position as shown in Table 1. The four countries leading the chart in the region are Singapore (84), New Zealand (83), Australia (77), and Hong Kong (74). Bhutan’s score of 72 in the CPI 2024 not only surpasses the average score of 44 for the Asia Pacific region but also the top performing region, which is the European Union with the average score of 62. In the neighborhood, Bhutan continues to maintain its streak as the top performer in the South Asian Region.
Table 1: Bhutan’s Global and Regional CPI Rank and Score from 2018-2024
| Year | Global Ranking | No. of participating countries | Score (0-100) | Asia Pacific Ranking | No. of Surveys Used | Confidence Range |
|---|---|---|---|---|---|---|
| 2024 | 18 | 180 | 72 | 5 | 4 | 69.31-74.69 |
| 2023 | 26 | 180 | 68 | 6 | 4 | 64-72 |
| 2022 | 25 | 180 | 68 | 6 | 4 | 64-72 |
| 2021 | 25 | 180 | 68 | 6 | 4 | 64.32-71.68 |
| 2020 | 24 | 180 | 68 | 6 | 4 | 64.08-71.92 |
| 2019 | 25 | 180 | 68 | 6 | 4 | 63.48-72.52 |
| 2018 | 25 | 180 | 68 | 6 | 4 | 63-73 |
Similar to the past years, four data sources were used for constructing Bhutan’s CPI. Among these data sources, except for ‘Varieties of Democracy Project’, all scores for other data sources have witnessed an increase as illustrated in Table 2.
Table 2: Data Sources for Bhutan’s CPI Score
| Year | World Bank Country Policy and Institutional Framework Assessment (CPIA) | Global Insight Country Risk Ratings | Bertelsmann Foundation Transformation Index | Varieties of Democracy Project |
|---|---|---|---|---|
| 2024 | 75 | 72 | 73 | 66 |
| 2023 | 60 | 71 | 69 | 70 |
| 2022 | 60 | 71 | 69 | 70 |
| 2021 | 60 | 71 | 69 | 71 |
| 2020 | 60 | 71 | 69 | 72 |
Bhutan’s CPI Analysis by Data Sources
The detailed analysis on the findings of these four data sources are as elucidated below:
- World Bank’s Country Policy & Institutional Assessment (CPIA)
The CPIA is a diagnostic tool that assesses the quality of a country’s policies and institutional arrangements necessary for sustainable socio-economic growth and poverty reduction through effective use of development assistance. Depending on the Country Performance Rating (CPR) derived from the CPIA, the International Development Association’s (IDA) allocates resources to a country.
While the overall CPIA score of Bhutan has declined by 0.083, from 3.844 in 2022 to 3.750 in 2023, Bhutan continues to perform comparatively better among countries in the South Asia Region as shown in Figure 1.

For the purpose of constructing the CPI score, the indicator ‘Transparency, Accountability, and Corruption in Public Sector’ under the Public Sector Management & Institutions Cluster of the CPIA is used. The indicator measures (a) accountability of the executive’s performance to oversight institutions and public employees; (b) access of civil society to information on public affairs; and (c) state capture by narrow vested interests. Bhutan has achieved a score of 4.5 out of 6 for this indicator in 2023 as shown in Table 3.
The score indicates effective corruption prevention strategies in preventing abuse of executive power, enhancing transparency in public spending and revenues, empowering media, civil society organizations, and private sector in strengthening integrity measures, among others.
On the hindsight, scores for the indicators have remained the same, indicating no paradigm shift in the policies and approaches to preventing corruption holistically. Some of the weak areas continuously featured viz. Social Protection, Financial Sector, Business Regulatory Environment, and Efficiency of Revenue Mobilization.
Since 2022, the score for ‘Monetary & Exchange Rate’ dimension has started declining with the score dipping to 3.5 in 2023 from 4.0 in 2022. The reasons for this decline can be attributed to the current account deficits and depletion of the foreign currency reserves. Similarly, the score for debt policy has dipped to 4.0 from 4.5 in 2022.Hence, the meager improvement in the CPIA indicators reiterate the need for holistic approach in uplifting overall score.
Table 3: Bhutan’s rating on World Bank CPIA from 2018-2023
| Clusters | SN | Criteria | 2023 | 2022 | 2021 | 2020 | 2019 | 2018 |
|---|---|---|---|---|---|---|---|---|
| Economic Management | 1 | Monetary & Exchange Rate | 3.5 | 4.0 | 4.5 | 4.5 | 4.5 | 4.5 |
| 2 | Fiscal policy | 3.5 | 3.5 | 4.0 | 4.0 | 4.0 | 4.0 | |
| 3 | Debt policy | 4.0 | 4.5 | 4.5 | 4.0 | 4.0 | 4.0 | |
| Structural Policies | 4 | Trade | 3.5 | 3.5 | 3.5 | 3.5 | 3.5 | 3.5 |
| 5 | Financial sector | 3.0 | 3.0 | 3.0 | 3.0 | 3.0 | 3.0 | |
| 6 | Business regulatory environment | 3.5 | 3.5 | 3.5 | 3.5 | 3.5 | 3.5 | |
| Policies for Social Inclusion & Equity | 7 | Gender equality | 4.0 | 4.0 | 4.0 | 4.0 | 4.0 | 4.0 |
| 8 | Equity of public resource use | 4.5 | 4.5 | 4.5 | 4.5 | 4.5 | 4.5 | |
| 9 | Building human resources | 4.5 | 4.5 | 4.5 | 4.5 | 4.5 | 4.5 | |
| 10 | Social protection & labor | 3.0 | 3.0 | 3.0 | 3.0 | 3.0 | 3.0 | |
| 11 | Environment sustainability | 4.0 | 4.0 | 4.0 | 4.0 | 4.0 | 4.0 | |
| Public Sector Management & Institutions | 12 | Property rights and rule-based governance | 4.0 | 4.0 | 4.0 | 4.0 | 4.0 | 4.0 |
| 13 | Quality of budgetary and financial management | 4.0 | 4.0 | 4.0 | 4.0 | 4.0 | 4.0 | |
| 14 | Efficiency of revenue mobilization | 3.5 | 3.5 | 3.5 | 3.5 | 3.5 | 4.0 | |
| 15 | Quality of public administration | 4.0 | 4.0 | 4.0 | 4.0 | 4.0 | 4.0 | |
| 16 | Transparency, accountability, and corruption in public sector | 4.5 | 4.5 | 4.5 | 4.5 | 4.5 | 4.5 |
2. Global Insight Country Risk Ratings
The CPI utilizes the score of the ‘Control of Corruption’ dimension of the Global Insight Country Risk Ratings, which measures the quality of governance across countries over time. The score of 0.83, which has remained same over the years, indicates low risks of bribery incidences, particularly in carrying out business activities.
Similarly, the scores for all other indicators have remained the same as shown in Table 4. While the ‘Political Stability and Absence of Violence’ reflect consistent stability with a laudable score, the stagnant score of 0.83 for the ‘Rule of Law’ and ‘Control of Corruption’ indicate the need for enhanced measures in promoting the capacity of the justice sector to support a clean business environment.
Contrarily, the low score for ‘Regulatory Quality’ dimension points to business operations rendered costly due to regulatory burden and bureaucratic inefficiency coupled with tax inconsistencies. The troubling trend in this dimension is corroborated by the consistent low score revealed by the CPIA in terms of ‘Business Regulatory Environment’ and ‘Efficiency of Revenue Mobilization’ underscoring the need to reinforce current efforts in stimulating business growth. Overall, the stagnant scores in all the dimensions reiterate the need for re-imagining current approaches.
Table 4: Score derived from the S&P Global
| Dimension | 2023 | 2022 | 2021 | 2020 | 2019 | 2018 |
|---|---|---|---|---|---|---|
| Political Stability and Absence of Violence | 0.92 | 0.92 | 0.92 | 0.92 | 0.92 | 0.92 |
| Government Effectiveness | 0.72 | 0.72 | 0.72 | 0.61 | 0.61 | 0.61 |
| Regulatory Quality | 0.58 | 0.58 | 0.58 | 0.58 | 0.58 | 0.58 |
| Rule of Law | 0.83 | 0.83 | 0.83 | 0.83 | 0.83 | 0.83 |
| Control of Corruption | 0.83 | 0.83 | 0.83 | 0.83 | 0.83 | 0.83 |
3. Bertelsmann Transformation Index (BTI)
The BTI measures the quality of democracy, market economy, and governance. Amongst that, the CPI in particular uses the ‘Rule of Law’ and ‘Resource Efficiency’ indicators under the Status and Governance Index respectively.
The score of 7.5 out of 10 for ‘Rule of Law’ indicates that public officials who violate the law and engage in corruption are typically prosecuted under established laws. The score also highlights Bhutan’s commitment in upholding rule of law which is manifested in the delinking of the Judiciary from the RCSC. In addition, the enhanced coordination among justice sector institutions including the establishment of a dedicated Law School besides the existing Bhutan National Legal Institute have reinforced Bhutan’s commitment in strengthening institutional capacity for fair, trustworthy, inclusive and accessible justice services.
Similarly, the score of 7.7 for the ‘Resource Efficiency’ signifies the government’s commitment in the fight against corruption through adoption of various integrity measures. Some of the key milestones underpinning the better performance in this indicator include, subjecting the government to periodic auditing and the auditing standards, dedicated anti-corruption agency to spearhead anti-corruption campaigns, rigorous efforts in effective dispute resolution for commercial disputes, and reforms initiated in strengthening the existing procurement and contracting system.
In addition, the analysis of other indicators of BTI reveals that Bhutan has continuously performed well in terms of Democracy Dimension as shown in Table 5. The progressive performance in this dimension can be attributed to an increase in the score for ‘Stateness’ and ‘Stability of Democratic Institutions’, highlighting a well-functioning State that is stable, free of non-state actors and separatists with robust institutions, and a resilient democratic system.
On the other hand, the performance in the Economy and Governance Dimensions has remained constant with no improvement, underscoring the need for paradigm shift in the policies concerning market economy and governance structures especially in the area of Market Organization, Monetary & Fiscal Stability, Welfare Regime, and Consensus-building.
Table 5: Bhutan’s rating in the BTI since 2014 through 2024
| SN | Indicators | 2024 | 2022 | 2020 | 2018 | 2016 | 2014 | |
|---|---|---|---|---|---|---|---|---|
| Democracy Status | 1 | Stateness | 7.8 | 7.5 | 7.3 | 7.3 | 7.3 | 7.0 |
| 2 | Political participation | 7.0 | 7.0 | 7.0 | 7.0 | 7.0 | 7.0 | |
| 3 | Rule of law | 7.5 | 7.5 | 7.3 | 7.3 | 7.3 | 7.0 | |
| 4 | Stability of democratic institutions | 8.5 | 8.0 | 8.0 | 7.0 | 7.0 | 7.0 | |
| 5 | Political & social integration | 5.3 | 5.3 | 4.8 | 4.3 | 4.0 | 4.0 | |
| Economy Status | 6 | Socio-economic development level | 5.0 | 5.0 | 5.0 | 5.0 | 5.0 | 4.0 |
| 7 | Market Organization | 4.5 | 4.5 | 4.5 | 4.5 | 3.8 | 3.5 | |
| 8 | Monetary & fiscal stability | 5.5 | 5.5 | 5.5 | 6.0 | 6.0 | 5.5 | |
| 9 | Private property | 7.0 | 7.0 | 7.5 | 7.5 | 5.5 | 5.5 | |
| 10 | Welfare regime | 5.0 | 5.0 | 4.5 | 4.5 | 4.5 | 4 | |
| 11 | Economic performance | 7.0 | 7.0 | 7.0 | 7.0 | 7.0 | 7.0 | |
| 12 | Sustainability | 6.0 | 6.0 | 6.0 | 7.0 | 7.0 | 5.5 | |
| Democracy Status + Economy Status=Status Index | 6.46 | 6.38 | 6.28 | 6.25 | 6.02 | 5.70 | ||
| Governance Performance | 13 | Steering capability | 7.3 | 7.3 | 7.3 | 6.7 | 6.7 | 6.3 |
| 14 | Resource efficiency | 7.7 | 7.7 | 7.7 | 7.7 | 7.3 | 7.0 | |
| 15 | Consensus-building | 6.0 | 6.0 | 6.0 | 6.0 | 6.0 | 5.4 | |
| 16 | International cooperation | 8.7 | 8.7 | 8.3 | 8.3 | 8.7 | 8.3 | |
| Level of difficulty | 17 | Level of difficulty | 5.4 | 5.6 | 6.0 | 5.8 | 6.3 | 6.7 |
| Governance Performance + Level of Difficulty= Government Index | 6.66 | 6.69 | 6.67 | 6.50 | 6.58 | 6.27 |
4. Varieties of Democracy
In terms of Varieties of Democracy, the CPI accounts following four indicators viz., ‘public sector corruption index’, ‘executive corruption index’, ‘legislative corruption’, and ‘judicial corruption’. The score obtained by the specific measurement indices are given in Table 6.
Table 6: Scores of different indices of the V-Dem considered for CPI
| Indicators | 2023 | 2022 | 2021 | 2020 | 2019 | 2018 |
|---|---|---|---|---|---|---|
| Executive bribery and corrupt exchanges | 1.84 | 1.84 | 2.03 | 2.03 | 2.03 | 2.03 |
| Executive embezzlement and theft | 1.36 | 1.36 | 2.02 | 1.98 | 1.98 | 1.98 |
| Public sector corrupt exchanges | 0.77 | 0.77 | 0.77 | 0.77 | 0.77 | 0.77 |
| Public sector theft | 1.24 | 1.24 | 1.24 | 1.27 | 1.27 | 1.27 |
| Judicial corruption decision | 0.89 | 0.89 | 0.89 | 0.89 | 0.89 | 0.89 |
| Legislature corrupt activities | 1.79 | 1.79 | 1.87 | 2.5 | 2.76 | 2.76 |
The public sector corruption and executive corruption index measure the extent to which the executives and public officials grant favors in exchange for bribe, kickbacks, or material inducement including the frequency of embezzlement or misappropriation of public funds for personal or family use. The indicator for judicial decision assesses the frequency of individuals or businesses making undocumented payments to expedite or delay judicial process or obtain favorable judicial decisions while legislative corruption measures whether the legislature abuses their position for financial gain. While the scores for 2023 have remained unchanged from 2022, ‘public sector corrupt exchanges’ has continuously scored low at 0.77 out of 4, indicating the presence of corruption within the public sector. This can also be corroborated by the Annual Report 2023-2024 wherein out of 138 individuals implicated in corruption cases, 88 pertain to the public sector (63.77%) in the Financial Year 2023-2024 alone. However, the continuous low score for the ‘judicial corruption decision’ indicates the increasing vulnerability of judicial services to corruption with the change in the legal environment. Additionally, while the executive corruption index and the indicator for legislative corruption showcase better scores, the declining trend over the years indicate the need for strengthening existing anti-corruption mechanisms.
Conclusion
The CPI 2024 attempts to connect the adverse effects of corruption in climate adaptation efforts. The CPI presents that corruption is one of the critical yet overlooked factors obstructing climate actions by influencing climate policies and actions, diverting funds intended for climate change mitigation measures, undermining regulatory oversight in enforcing environmental laws and policies, and risking those at the frontlines of the climate crisis. Thus, the CPI 2024 reiterates the urgency of global efforts in combating corruption in order to confront climate change.
In this regard, the CPI 2024 recommends the governments and relevant stakeholders to:
- Uphold integrity at the center of climate efforts for achieving real impact;
- Ensure that the climate policymaking is free from undue influence at national, regional, international for resilient climate actions;
- Strengthen investigations, sanctions, and protections in fighting corruption; and
- Enhance citizen engagement in the accountability framework of climate investment for inclusive and practical mitigation measures.
Acknowledging the unwavering political will of the leaders in driving anti-corruption agenda, unstinted efforts of the relevant stakeholders in mainstreaming anti-corruption measures as an integral part of the overall governance system, and unequivocal support from the society in denouncing corruption, the ACC solicits the continued support of the government, media, civil society organizations, and private sector in bolstering existing anti-corruption efforts as follows:
- Strengthen institutional capacity of justice sector institutions for independent, competent, and credible justice services;
- Enhance business integrity initiatives including incentive mechanism to promote fair business environment;
- Reinforce existing climate leadership for ensuring corruption-resilient climate actions;
- Enhance regulatory oversight role to reinforce accountability in the public sector;
- Enhance proactive research and intelligence based anti-corruption measures to manage emerging corruption issues.
Source: CPI 2024